Despite an unmatched variety of experiences, Roblox stands out in the gaming industry for its unique identity as a User-Generated Content (UGC) platform, empowering users to build and launch experiences and to connect with a worldwide community of players. Through Roblox Studio, developers are equipped with accessible tools that offer unprecedented ease and flexibility in bringing creative visions to life.
However, amidst an offering of over 40M creations, the challenge lies in making one's stand out. But what does it take to achieve fame within the Roblox community? Continue reading to explore the factors within a developer’s control, those beyond it, and understand how Roblox's most celebrated titles ascended to stardom.
A Guide to Metrics and KPIs for Roblox Developers
Welcoming users of all skill levels cultivated a community of creators committed to embracing the challenge and investing their time and effort in developing their unique experiences.
Remarkably, the platform has witnessed countless inspiring stories of users who began as players and evolved into creators, crafting successful experiences that have profoundly impacted their lives. One inspiring example is Clarence Maximillian, who first logged into Roblox at nine years old, and collaborated with peers during college to craft Frontlines, an FPS (first-person shooter) experience with over 109.2 million visits, whose high-fidelity graphics revolutionized Roblox. The 28-year-old is currently CEO and creative director of Maximillian Studios, a trailblazing gaming entity within the Roblox community.
In this exemplary story, as in any Roblox experience, success wasn’t merely a result of creating the initial experience. Time and effort extended far beyond the development phase, with the launch being merely the prologue to an extensive journey. Within an ever-evolving industry, where innovation is constant and competition fierce, staying ahead of the curve entails more than original concepts and compelling gameplay, it entails continuous enhancement and adaptation attuned to player behavior. This is where metrics and KPIs (key performance indicators) come into play.
Metrics represent measurable data points used to analyze various aspects of an experience, while KPIs represent specific metrics chosen to assess the success of an experience against predetermined goals. Effectively deciphering this data empowers developers to make informed decisions regarding updates, events, integrations, and other essential elements vital to the ongoing success of an experience. In essence, these metrics and KPIs guide the creation of content and strategic initiatives, all aimed at enhancing an experience to better match the evolving needs and preferences of the community.
In this guide, Exclusible explores the intricate process of decoding data analytics on Roblox, uncovering vital metrics and KPIs. From retention and engagement to monetization and beyond, we will unveil the keys to unlocking sustained success in the ever-evolving realm of Roblox development.
Decoding Data on Roblox
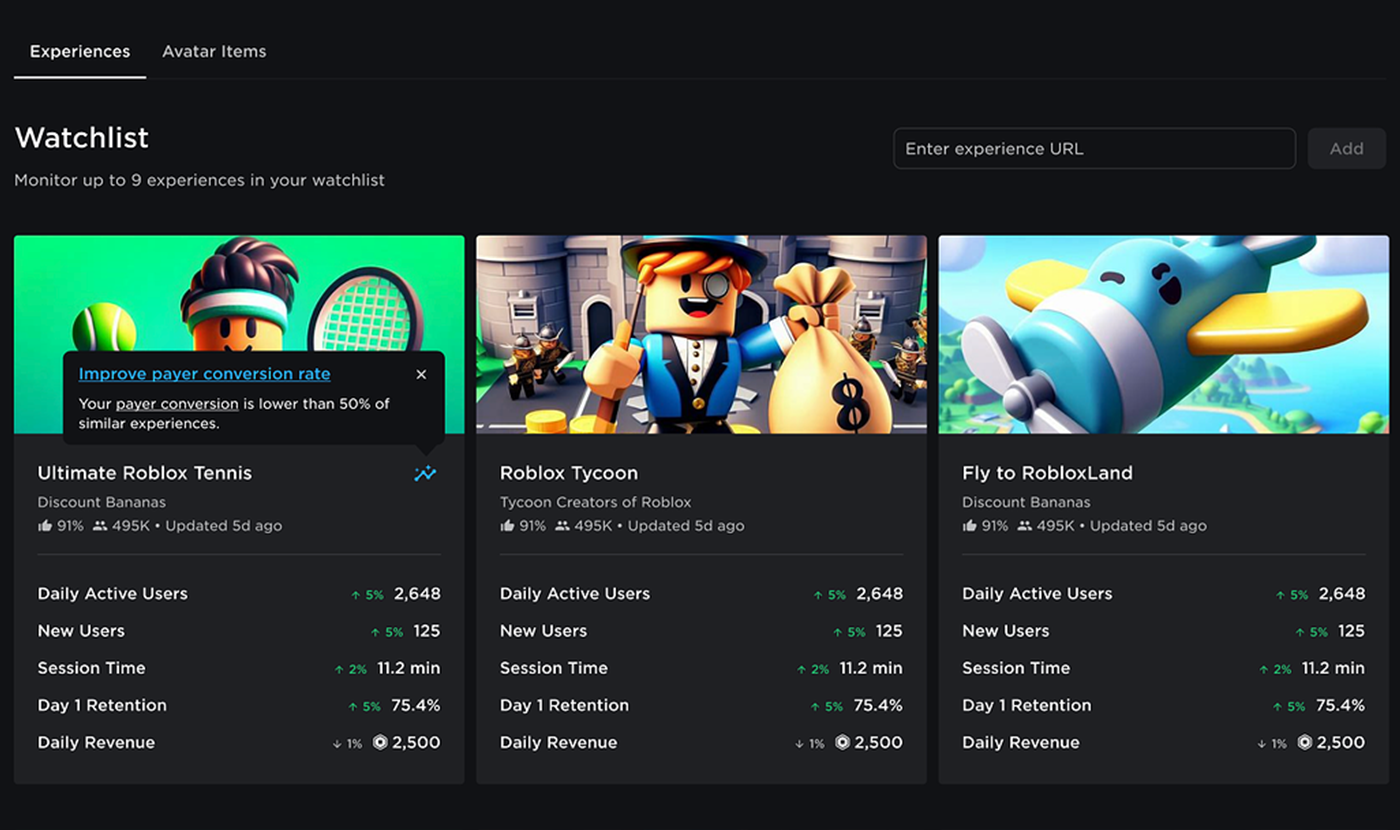
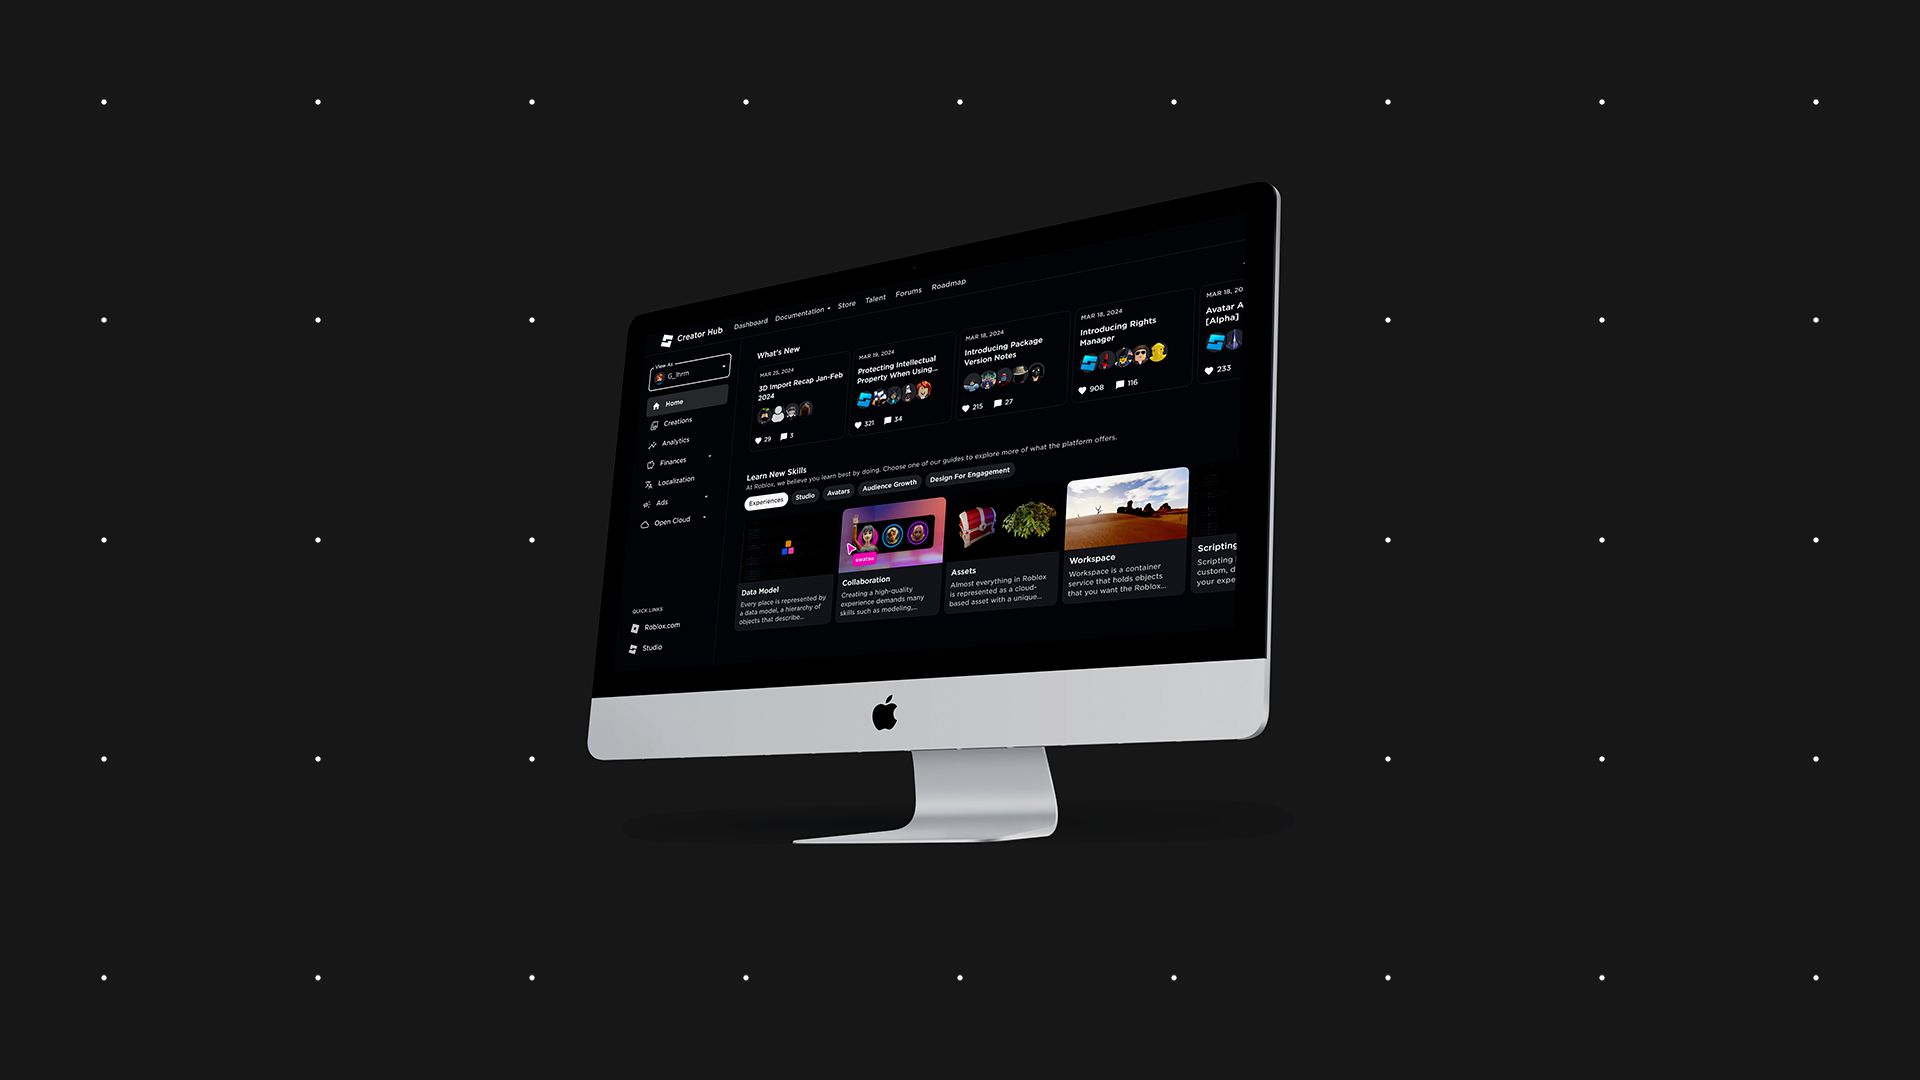
The initial step in decoding data on Roblox involves navigating to the Creator Hub, where developers are provided access to an analytics page designed specifically for monitoring up to nine of their experiences. This feature empowers developers with insights into their creations’ performance by presenting an array of KPIs at a glance:
Daily Active Users: Number of unique players who joined the game at least once in a given day.
New Users: Number of DAUs who are first-time users.
Session Time: Total play time divided by the number of individual sessions each day.
Day 1 Retention: Percentage of new users who played again after their first session ended.
Daily Revenue: Total amount of Robux earned by an experience in a day.
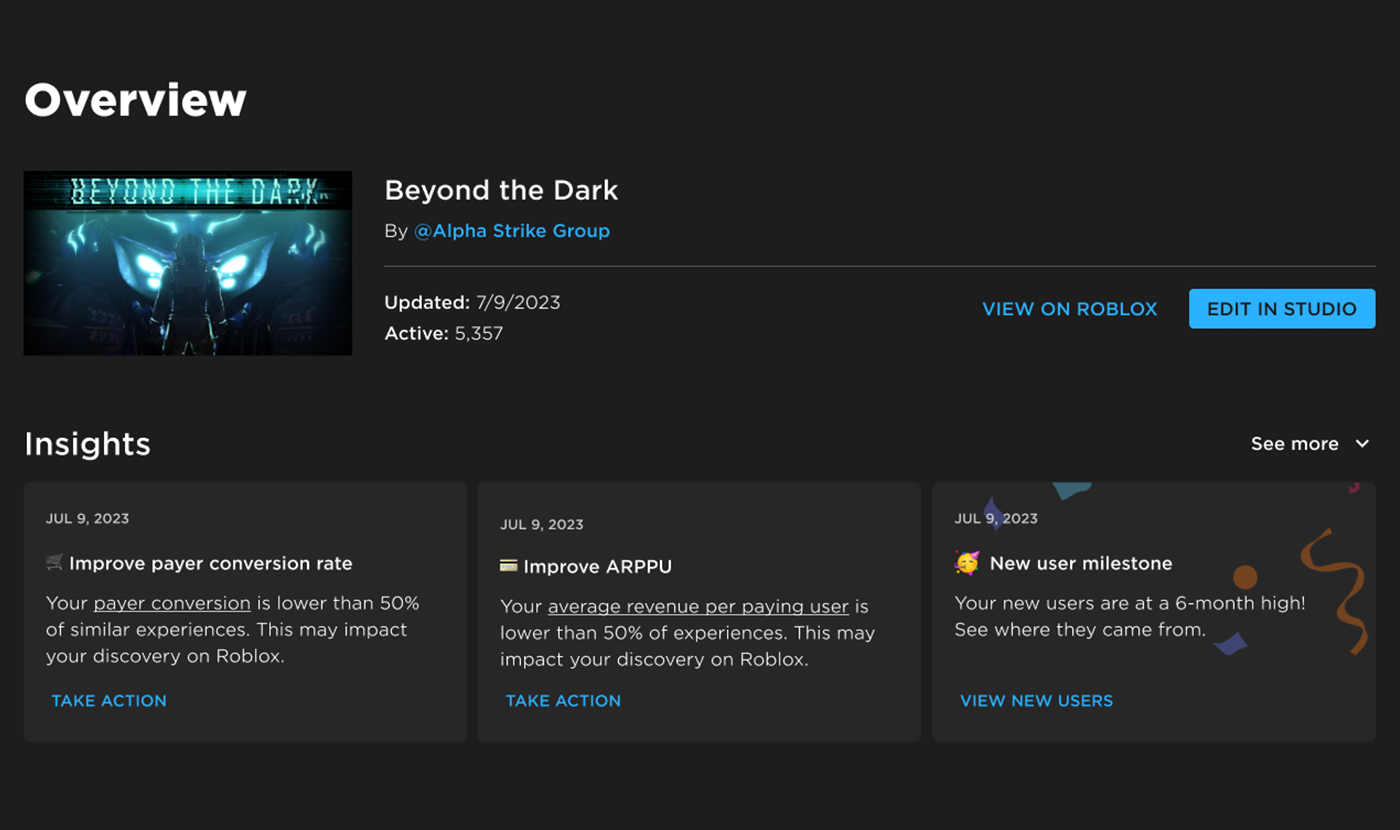
Clicking on a monitored experience within the watchlist directs developers to the experience overview page, which features a main dashboard showcasing the analytics previously presented on the watchlist. In addition, developers are greeted with three dynamic analytics insights designed to empower action:
Benchmark comparison: When a specific KPI is lower than 50% of similar experiences, developers are noted and advised on strategically adjusting the experience to improve outcomes.
Weekly trends analysis: When a specific KPI has increased or decreased week over week, developers are noted, facilitating timely interventions to leverage successes or address deficiencies.
Performance peaks identification: When a specific KPI is at a six-month high, developers are noted, prompting acknowledgment of progress. However, if it remains below benchmark standards, developers are encouraged to persist in their efforts to enhance performance.
Accessible from the menu on the overview page, developers can navigate to the Analytics tab, offering access to a range of metric subcategories. Among these, the three most crucial metrics are:
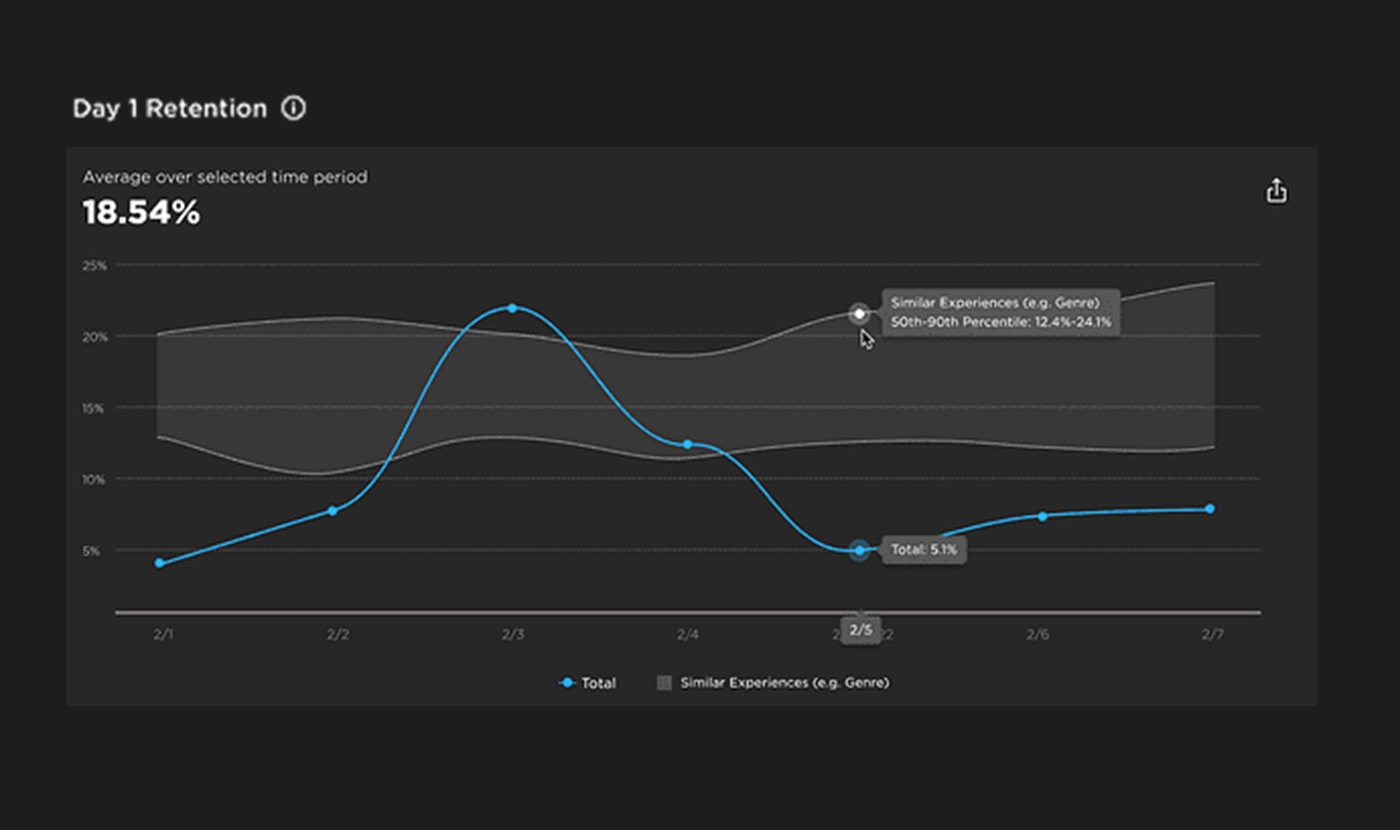
Retention: This metric measures the number of users who revisit an experience after their initial visit. Within this subcategory, developers can access various dashboards showcasing different KPIs, with the following three being the most pivotal:
- Day 1 Retention: Measures the number of players who return to an experience on their second day (D1) from the first day they played the experience (D0).
- Day 7 Retention: Measures how many players return to an experience after 7 days.
- Day 30 Retention: Measures how many players return to an experience after 30 days.
Engagement: This metric reflects how users actively engage with an experience. Within this subcategory, developers can access various dashboards showcasing different KPIs, with the following three being the most pivotal:
- Daily Active Users: Measures the number of players that are in an experience for a given day.
- Monthly Active Users: Measures the number of players that are in an experience for a given month.
- Average Session Length: Measures how long a player plays an experience on average from the start of their session to the time they log out.
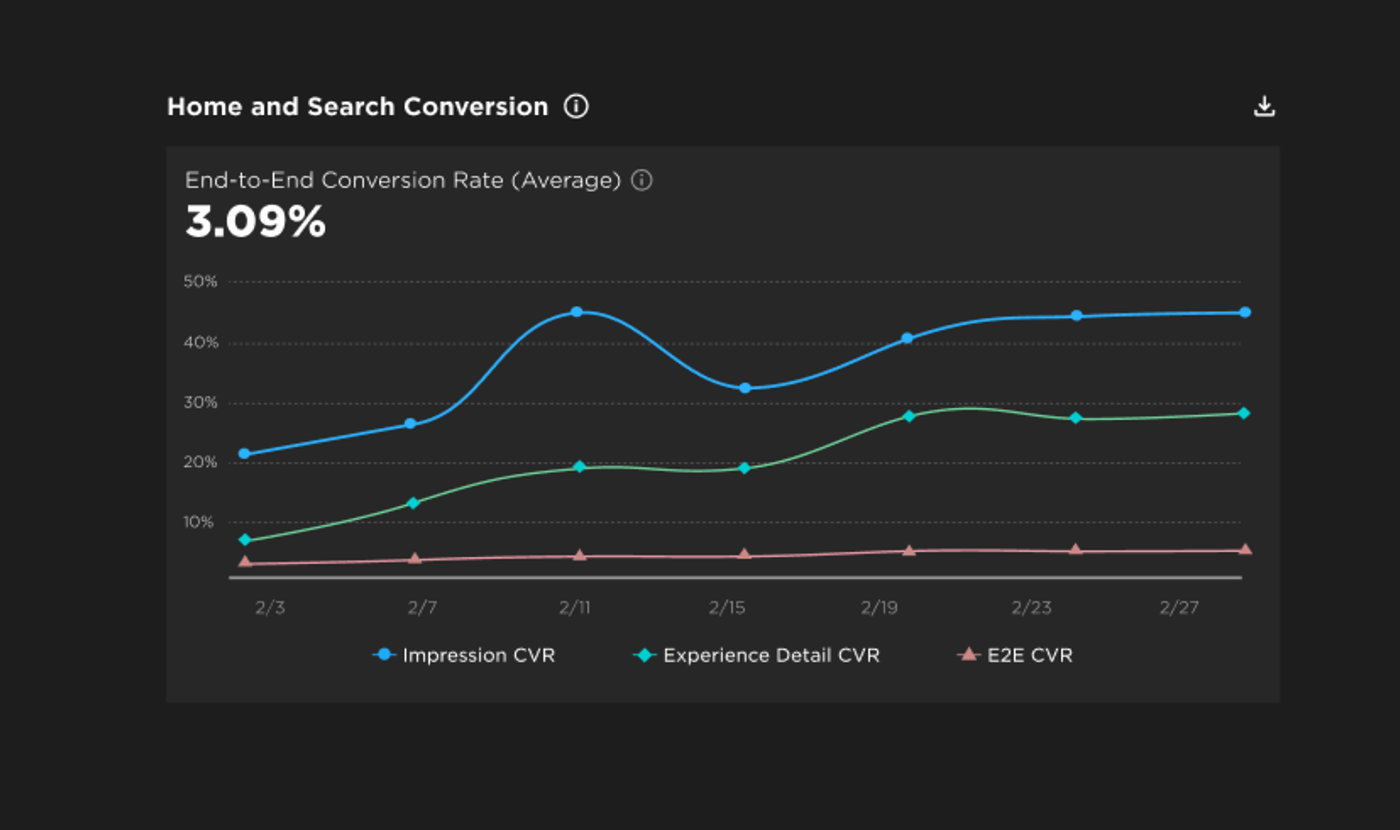
Monetization: This metric measures the business performance of an experience. Within this subcategory, developers can access various dashboards showcasing different KPIs, with the following three being the most pivotal:
- Average Revenue per Daily Active User: Measures the average spending per user engaged with an experience on a daily basis.
- Conversion Rate: Measures the number of players who have made any monetary transactions within an experience.
- Average Revenue per Paying User: Measures the total spending of all users who have made purchases within an experience.
Each dashboard offers an array of functionalities tailored to empower developers in analyzing the performance of their creations, from filtering by date to exporting a chart. However, among these, benchmarking stands out, serving as a crucial tool for accurate evaluation. Benchmarking involves measuring the KPIs of an experience and comparing them against similar experiences within the same genre. This process aids developers in fine-tuning their content strategy and establishing appropriate goals for improvement.
The KPIs available for benchmarking include all retention KPIs, average session duration, average revenue per daily active user, conversion rate, and average revenue per paying user. Each KPI showcases its similar experience benchmark within the 50th – 90th percentile range. For instance, if the benchmark for day 1 retention spans from the 50th to 90th percentile, registering 12.4% – 24.1% implies that 50% of similar experiences exhibit a day 1 retention rate of 12.4% or less, while 10% showcase a rate of 24.1% or higher.