Decoding Data: A Guide to Metrics and KPIs for Roblox Developers
- Read time 5min
- published 2024.03.27 updated 2024.03.27
-
what
- Blog
- Brands
- Gaming
Despite an unmatched variety of experiences, Roblox stands out in the gaming industry for its unique identity as a User-Generated Content (UGC) platform, empowering users to build and launch experiences and to connect with a worldwide community of players. Through Roblox Studio, developers are equipped with accessible tools that offer unprecedented ease and flexibility in bringing creative visions to life.
A Guide to Metrics and KPIs for Roblox Developers
Remarkably, the platform has witnessed countless inspiring stories of users who began as players and evolved into creators, crafting successful experiences that have profoundly impacted their lives. One inspiring example is Clarence Maximillian, who first logged into Roblox at nine years old, and collaborated with peers during college to craft Frontlines, an FPS (first-person shooter) experience with over 109.2 million visits, whose high-fidelity graphics revolutionized Roblox. The 28-year-old is currently CEO and creative director of Maximillian Studios, a trailblazing gaming entity within the Roblox community.
In this exemplary story, as in any Roblox experience, success wasn’t merely a result of creating the initial experience. Time and effort extended far beyond the development phase, with the launch being merely the prologue to an extensive journey. Within an ever-evolving industry, where innovation is constant and competition fierce, staying ahead of the curve entails more than original concepts and compelling gameplay, it entails continuous enhancement and adaptation attuned to player behavior. This is where metrics and KPIs (key performance indicators) come into play.
Metrics represent measurable data points used to analyze various aspects of an experience, while KPIs represent specific metrics chosen to assess the success of an experience against predetermined goals. Effectively deciphering this data empowers developers to make informed decisions regarding updates, events, integrations, and other essential elements vital to the ongoing success of an experience. In essence, these metrics and KPIs guide the creation of content and strategic initiatives, all aimed at enhancing an experience to better match the evolving needs and preferences of the community.
In this guide, Exclusible explores the intricate process of decoding data analytics on Roblox, uncovering vital metrics and KPIs. From retention and engagement to monetization and beyond, we will unveil the keys to unlocking sustained success in the ever-evolving realm of Roblox development.
Decoding Data on Roblox
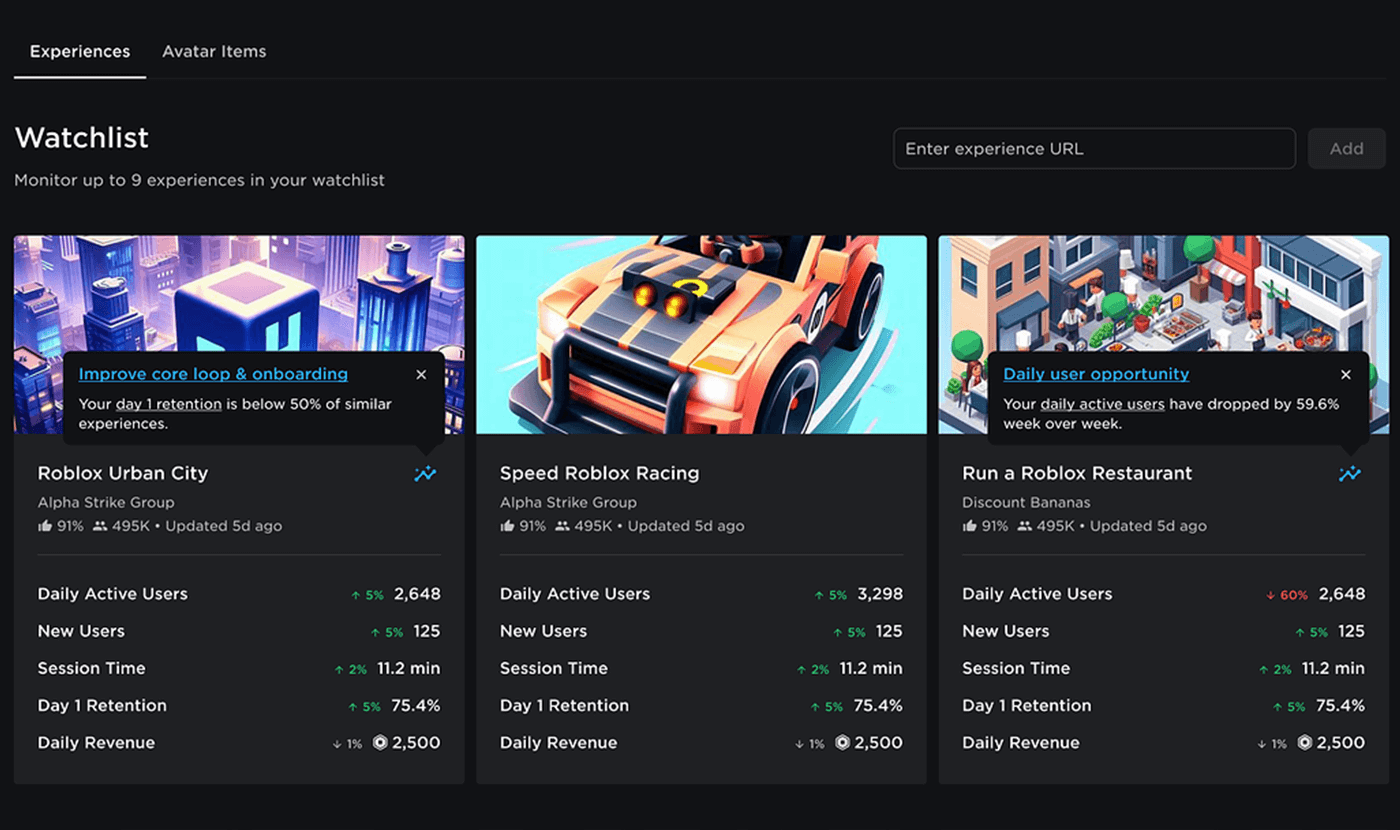
The initial step in decoding data on Roblox involves navigating to the Creator Hub, where developers are provided access to an analytics page designed specifically for monitoring up to nine of their experiences. This feature empowers developers with insights into their creations’ performance by presenting an array of KPIs at a glance:
Daily Active Users: Number of unique players who joined the game at least once in a given day.
New Users: Number of DAUs who are first-time users.
Session Time: Total play time divided by the number of individual sessions each day.
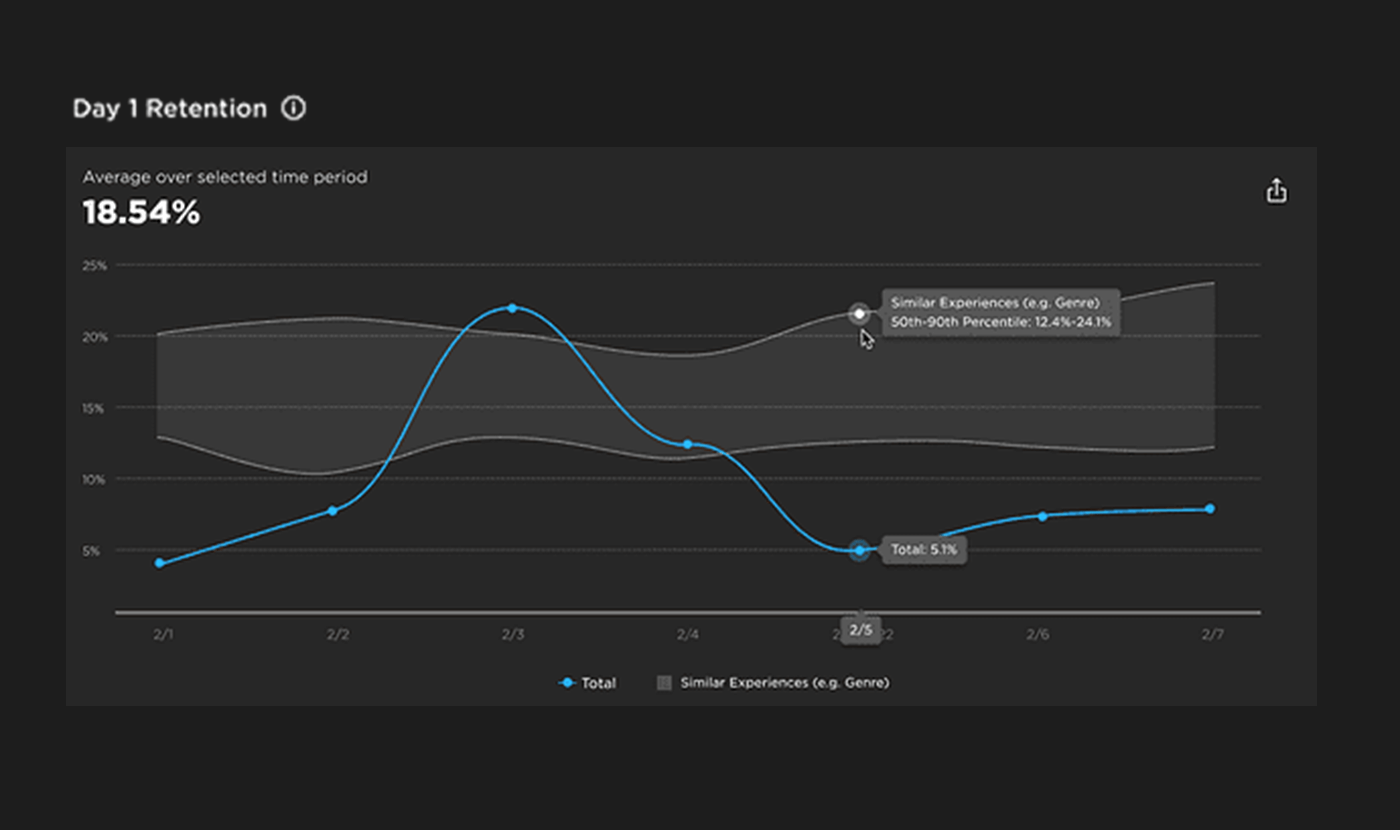
Day 1 Retention: Percentage of new users who played again after their first session ended.
Daily Revenue: Total amount of Robux earned by an experience in a day.
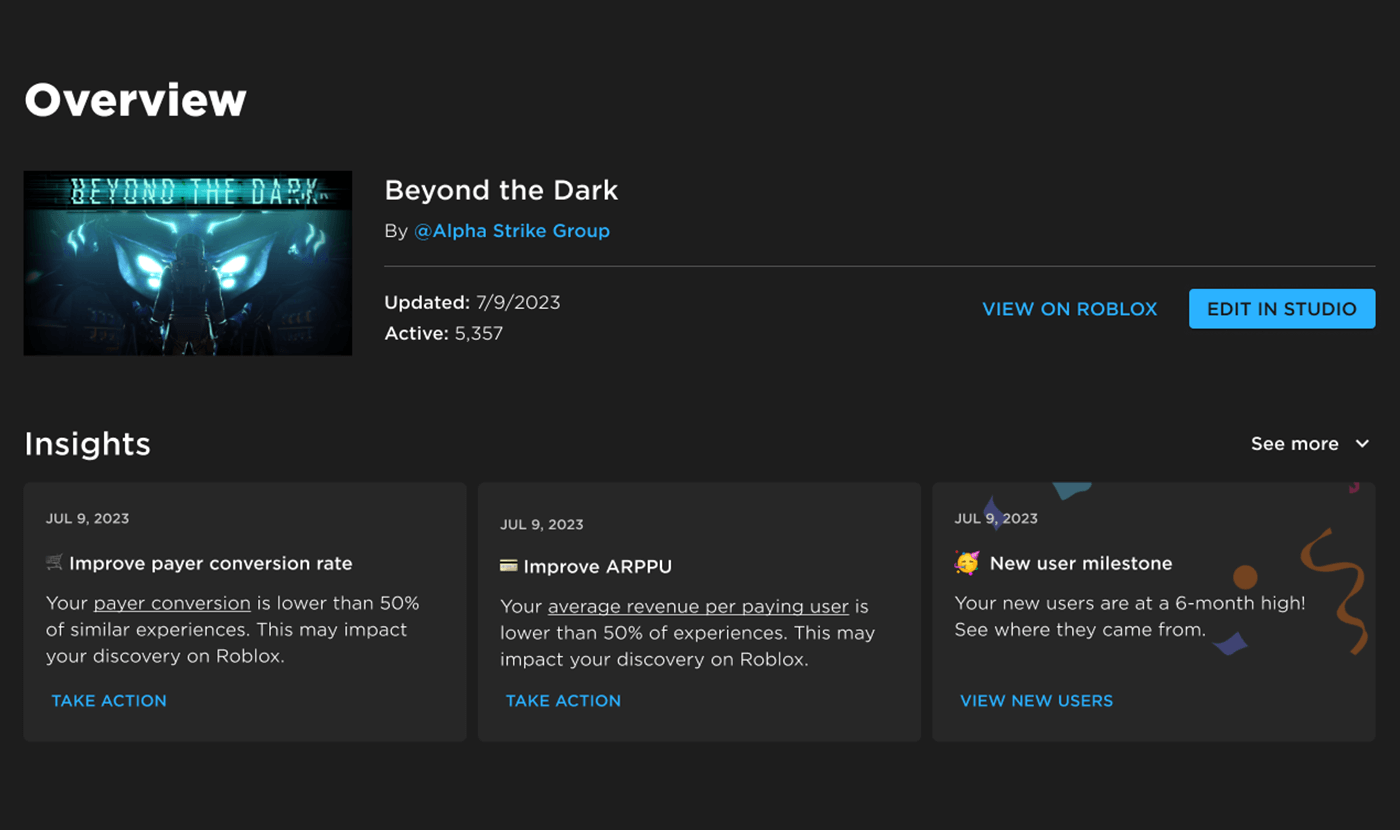
Clicking on a monitored experience within the watchlist directs developers to the experience overview page, which features a main dashboard showcasing the analytics previously presented on the watchlist. In addition, developers are greeted with three dynamic analytics insights designed to empower action:
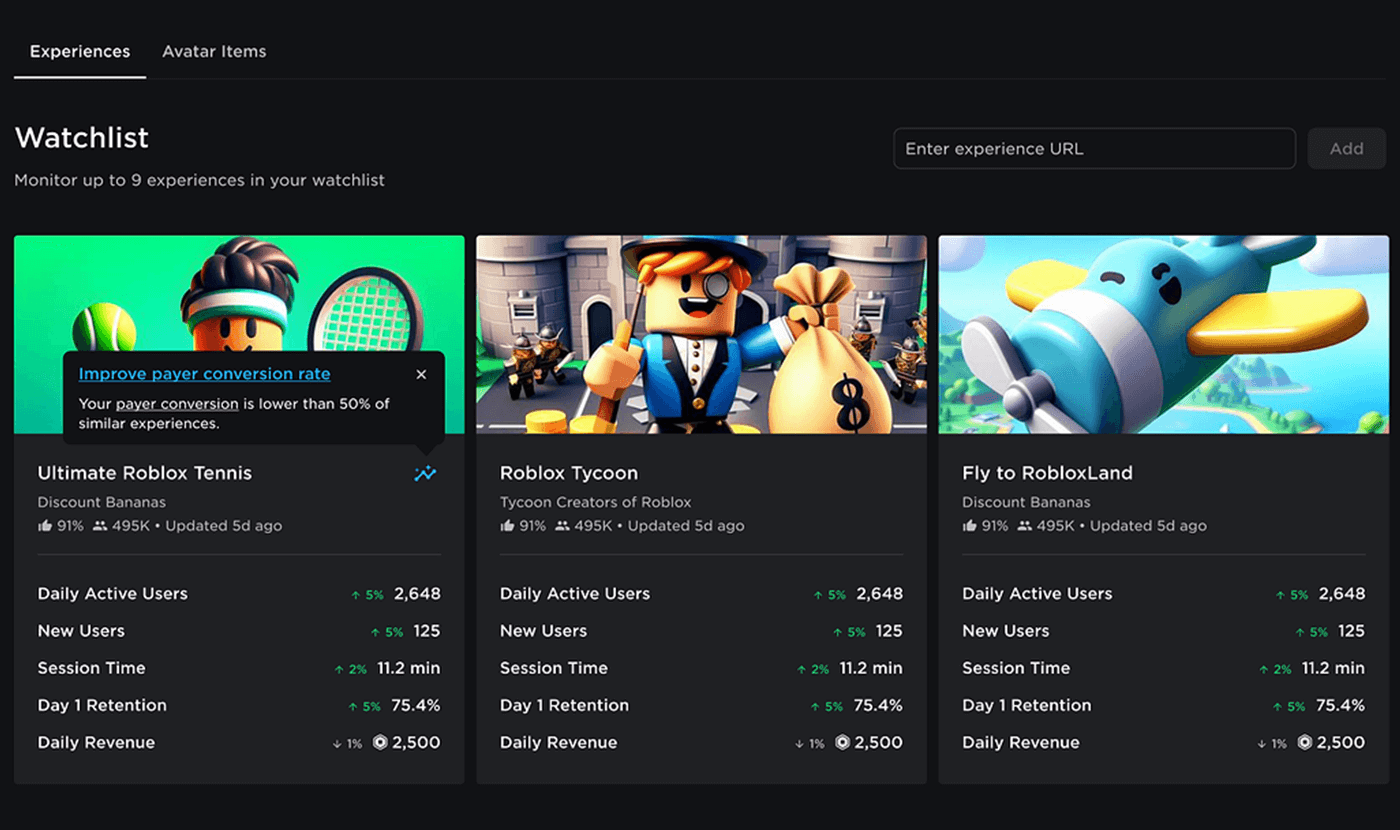
Benchmark comparison: When a specific KPI is lower than 50% of similar experiences, developers are noted and advised on strategically adjusting the experience to improve outcomes.
Weekly trends analysis: When a specific KPI has increased or decreased week over week, developers are noted, facilitating timely interventions to leverage successes or address deficiencies.
Performance peaks identification: When a specific KPI is at a six-month high, developers are noted, prompting acknowledgment of progress. However, if it remains below benchmark standards, developers are encouraged to persist in their efforts to enhance performance.
Accessible from the menu on the overview page, developers can navigate to the Analytics tab, offering access to a range of metric subcategories. Among these, the three most crucial metrics are:
Retention: This metric measures the number of users who revisit an experience after their initial visit. Within this subcategory, developers can access various dashboards showcasing different KPIs, with the following three being the most pivotal:
- Day 1 Retention: Measures the number of players who return to an experience on their second day (D1) from the first day they played the experience (D0).
- Day 7 Retention: Measures how many players return to an experience after 7 days.
- Day 30 Retention: Measures how many players return to an experience after 30 days.
Engagement: This metric reflects how users actively engage with an experience. Within this subcategory, developers can access various dashboards showcasing different KPIs, with the following three being the most pivotal:
- Daily Active Users: Measures the number of players that are in an experience for a given day.
- Monthly Active Users: Measures the number of players that are in an experience for a given month.
- Average Session Length: Measures how long a player plays an experience on average from the start of their session to the time they log out.
Monetization: This metric measures the business performance of an experience. Within this subcategory, developers can access various dashboards showcasing different KPIs, with the following three being the most pivotal:
- Average Revenue per Daily Active User: Measures the average spending per user engaged with an experience on a daily basis.
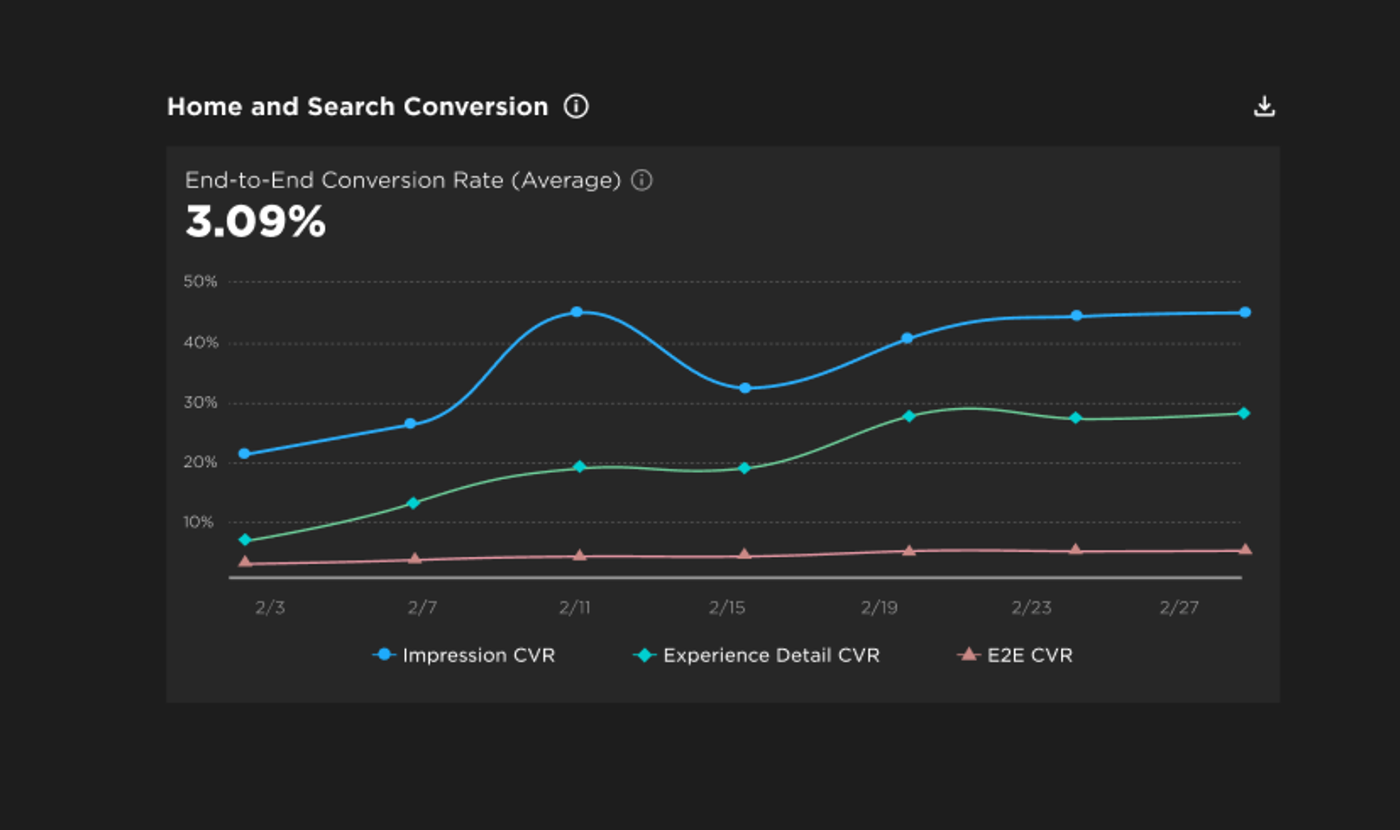
- Conversion Rate: Measures the number of players who have made any monetary transactions within an experience.
- Average Revenue per Paying User: Measures the total spending of all users who have made purchases within an experience.
Each dashboard offers an array of functionalities tailored to empower developers in analyzing the performance of their creations, from filtering by date to exporting a chart. However, among these, benchmarking stands out, serving as a crucial tool for accurate evaluation. Benchmarking involves measuring the KPIs of an experience and comparing them against similar experiences within the same genre. This process aids developers in fine-tuning their content strategy and establishing appropriate goals for improvement.
The KPIs available for benchmarking include all retention KPIs, average session duration, average revenue per daily active user, conversion rate, and average revenue per paying user. Each KPI showcases its similar experience benchmark within the 50th – 90th percentile range. For instance, if the benchmark for day 1 retention spans from the 50th to 90th percentile, registering 12.4% – 24.1% implies that 50% of similar experiences exhibit a day 1 retention rate of 12.4% or less, while 10% showcase a rate of 24.1% or higher.
Growing a Roblox Experience with Analytics
Understanding analytics within the Roblox ecosystem is essential for developers, as it offers invaluable insights into user behavior, game performance, and content optimization. In this section, we delve into the fundamental steps to grow a Roblox experience with analytics, grasping basic concepts to interpreting data effectively. Whether you’re a newcomer or seeking to refine your skills, this guide aims to provide practical advice for navigating the world of Roblox analytics with confidence and clarity.
Prior to scaling user acquisition efforts, developers must concentrate on elevating the following metrics to levels that either meet or surpass benchmarks established by similar experiences:
Day 1 Retention and Average Session Time
Day 1 retention and average session time must be prioritized as they measure the initial user experience, assessing whether new players find the experience engaging and return for more. A low day 1 retention and average session time typically signal poor user onboarding. Such outcomes often imply user confusion, frustration, or delayed gratification. Enhancing these metrics entails optimizing the core loop, the first-time user experience, and performance.
Core Loop
Core loop stans for the series of actions users repetitively undertake to advance within a single session. For instance, in a pet adoption experience, the core loop might involve adopting pets, training them, and leveling them up. Strategies for improving an experience’s core loop include:
Identifying the fundamental actions users engage in within the core loop and ensuring they are understandable and enjoyable.
Clear communication and intuitive design can significantly enhance user engagement.
Balancing the core loop to prevent user frustration or monotony. Adjusted difficulty levels and dynamic challenges can keep users engaged without overwhelming them.
Providing meaningful rewards to users upon completing the core loop. Awarded in-game currency or items can foster a sense of accomplishment and encourage continued engagement.
First-time User Experience
First-time user experience stands for how users engage with the core loop during their initial encounter. Strategies for improving the first-time user experience include:
Implementing a brief tutorial or contextual information, such as tooltips, to seamlessly guide users through the core loop.
Ensuring a delightful moment awaits users upon their first completion of the core loop. This could be a rewarding animation, a congratulatory message, or a visually pleasing graphic to signify achievement.
Providing a glimpse into the potential progress users can achieve through repeated engagements with the core loop. Offering previews of unlocked features, advanced levels, or additional rewards to motivate users to continue engaging.
Incorporating analytics is paramount in refining the first-time user experience. Key strategies involve:
Identifying and listing the sequential steps of the core loop experience. For instance, in a pet adoption scenario, the core loop may encompass adopting, training, and leveling up a pet.
Tracking the completion rate of each step within the core loop. For example, in a scenario involving battling NPCs (non-player characters), monitoring win/loss frequencies sheds light on user engagement dynamics.
Identifying significant drop-offs and taking corrective measures. For instance, in a pet adoption experience, if there’s a notable decline in user engagement at the pet store, reducing friction in this step by making the pet store easier to find can be instrumental in sustaining user interest.
Performance
Performance stands for the efficiency with which an experience operates across various devices and platforms. Strategies for improving performance include:
Conducting thorough testing across diverse devices and platforms to pinpoint and rectify any bugs that could potentially hinder performance.
Continuously monitoring crash rates, frame rates, and error occurrences with each iteration or update of the experience.
Establishing a user community capable of actively identifying and reporting bugs and crashes, thereby facilitating swift resolution and improvement efforts.
Day 7 and Day 30 Retention
Day 7 and Day 30 Retention are vital indicators of users’ sustained engagement and long-term commitment to the experience.
A low Day 7 retention may signal deficiencies in the progression system, indicating that players lack compelling reasons to continue beyond the initial week. Similarly, a diminished Day 30 retention suggests inadequacies in end-game content or goals, raising concerns about the depth and variety offered in the final stages to retain seasoned players. Enhancing these metrics entails a comprehensive refinement of your experience’s progression and ending system.
Progression System
A robust progression system is instrumental in guiding users toward achieving their goals and earning rewards within an experience through leveling up or unlocking fresh content. The strategies to cultivate a thriving progression system include:
Establishing clear user goals, from concise short-term goals providing users with immediate gratification and feedback to long-term goals offering a direction for sustained engagement over time.
Diversifying content offerings, from new gameplay modes to an expanding inventory of items, and engaging social features. The infusion of variety ensures that users encounter novel challenges and experiences, reducing the risk of monotony.
Fine-tuning difficulty levels is essential to maintain a delicate balance that sustains user engagement and motivation. Progression should neither be excessively swift, resulting in premature exhaustion of available content, nor overly sluggish, leading to user disinterest and frustration.
Incorporating analytics is paramount in refining the progression system. Key strategies involve:
Defining the specific progression system in place, whether it involves earning in-experience currency in a tycoon setting, unlocking new collectibles for an item collection experience, or mastering casts and skills in a magic world experience.
Tracking user progress across various levels to understand pacing and engagement patterns by rewarding milestones with special in-experience items.
Utilizing collected data to identify areas for improvement. If users are progressing too quickly or slowly, it is essential to assess the difficulty of tasks within the progression system and recalibrate as necessary to ensure users spend an optimal amount of time on each level.
Ending System
The ending system encompasses the features accessible to users upon completing the primary objectives of the experience or advancing to higher levels. The strategies to cultivate a thriving ending system include:
Keeping users invested by providing regular content updates to the existing mechanics. A common frequency is to release smaller updates every 2-4 weeks, addressing tweaks and enhancements, and bigger updates of new features every 2-3 months, which ensures a dynamic and fresh environment.
Social Mechanics Integration: Introducing social mechanics to foster community engagement and interaction among users, such as trading systems, where players can exchange items or resources, parties for cooperative play, guilds for forming alliances and pursuing collective objectives, and competitive elements like PvP matches, tournaments, and leaderboards to spark friendly rivalry and encourage progression.
Conversion Rate and Average Revenue per Paying User
The conversion rate and average revenue per paying user are pivotal metrics for evaluating the effectiveness of an experience’s monetization strategy, which encompasses the ability of an experience to capitalize on user interactions and generate sustainable revenue streams.
Conversion Rate
The conversion rate is essential in measuring the number of players who engage with your paid features or content. Strategies for improving the conversion rate include:
Diagnosing low conversion causes by delving into potential factors like exorbitant item pricing, inadequate item or shop visibility, and uninspiring content to pinpoint why conversion rates lag.
Embracing welcome offers and incentives tailored for first-time purchasers. Such initiatives effectively reduce the entry barrier, encouraging new users to explore and enjoy paid content.
Conduct a meticulous analysis of the purchase journey, identifying and rectifying any issues. Looking out for ambiguities or distractions hindering users from smoothly navigating through the purchase process, ensuring a seamless transaction experience.
Average Revenue per Paying User
The average revenue per paying user is vital for assessing the spending behavior of repeat purchasers. Strategies for improving the average revenue per paying user include:
Introducing purchasing options aligned with users’ engagement levels. This includes offering both one-time purchases and recurring transactions such as consumables, refills, and in-game currencies. By accommodating diverse buying preferences, users can choose the option that best suits their gaming experience and budget.
Diversifying the selection of purchasable items to ensure a dynamic marketplace. This strategy prevents stagnation and ensures there’s always something fresh for users to explore and acquire.
Infusing excitement and novelty into the purchasing experience by introducing seasonal offerings, which can align with holidays, cultural celebrations, or real-world events, creating anticipation and fostering a sense of community engagement. By rotating seasonal items, users are encouraged to regularly check in and participate in themed activities.
Once the retention, engagement, and monetization strategies are fine-tuned, the developer’s attention must be turned to analyzing the acquisition page within the experience overview. This analysis will provide insights into the origins of new users and the effectiveness of each source in converting them.
To enhance the conversion rate, it is vital to experiment with various elements, including experience icons, titles, and descriptions. These components must be authentic and unique to the experience, incorporating well-known genre terms and keywords. The ultimate task is to evaluate how these adjustments impact the conversion rate to identify what resonates best with the audience. The primary objective is to assess the impact of these refinements on the conversion rate, pinpointing the elements that most effectively resonate with the audience.
Given the inherently social nature of Roblox experiences, capitalizing on this by leveraging features like events and player invite prompts is of the utmost importance. Developers must encourage users to invite their friends to join the experience, as users often enjoy exploring together. By fostering a sense of community and camaraderie, the engagement and retention within the experience can further be amplified.
Once the experience is updated, it is essential to regularly delve into the analytics to measure the impact on the following metrics:
Retention: Assess the impact on Day 1, Day 7, and Day 30 retention.
Engagement: Analyze changes in average session duration.
Monetization: Evaluate shifts in conversion rates, average revenue per paying user, and overall revenue generation.
Acquisition: Examine fluctuations in the influx of new users and conversion rates across various acquisition sources.
Final Remarks
In the dynamic landscape of Roblox, staying attuned to the community’s pulse through metrics and KPIs is indispensable. By closely monitoring and interpreting these indicators, developers and brands can craft experiences that resonate deeply with their audience, ensuring sustained engagement, growth, and success in the virtual worlds they create.
Amidst this continued and intricate process of tracking, analyzing, comparing, and deriving actionable insights to drive decision-making toward optimal experiences, partnering with industry experts becomes invaluable. Exclusible is an innovative studio specializing in building and launching gaming and immersive experiences for brands. Apart from development, our team of experts provides complementary marketing services, where a go-to-market strategy plan is designed and deployed, activating influencers and the right platforms for experience promotion. Once experiences are launched, Exclusible provides full metrics and analytics reporting. These insights, meticulously analyzed by our experts, guide the development of engaging content, consistent updates, interactive events, and experience improvements, ensuring players feel heard and valued, and encouraging them to invest their time and creativity, thus ensuring sustained success, unparalleled player engagement, and retention.